
DESCRIPTION
The Iowa Balance of State COC in Cooperation with the Polk County Iowa COC and ICA developed the Performance Measures Dashboard. Measures are run on a quarterly basis. They can be compared between COCs. The report is dynamic and responsive. Most displayed values have toggles and switches to set parameters. The report was implemented as a Tableau dashboard, so now not just the committee but the whole of the continuum can explore their data at their leisure.
The response from the committee, the board and the community has been universally positive ans we are constantly seeing this work result in real and actionable policy direction within the CoCs.
Balance of State Dashboard
Polk County Dashboard
Siouxland Dashboard

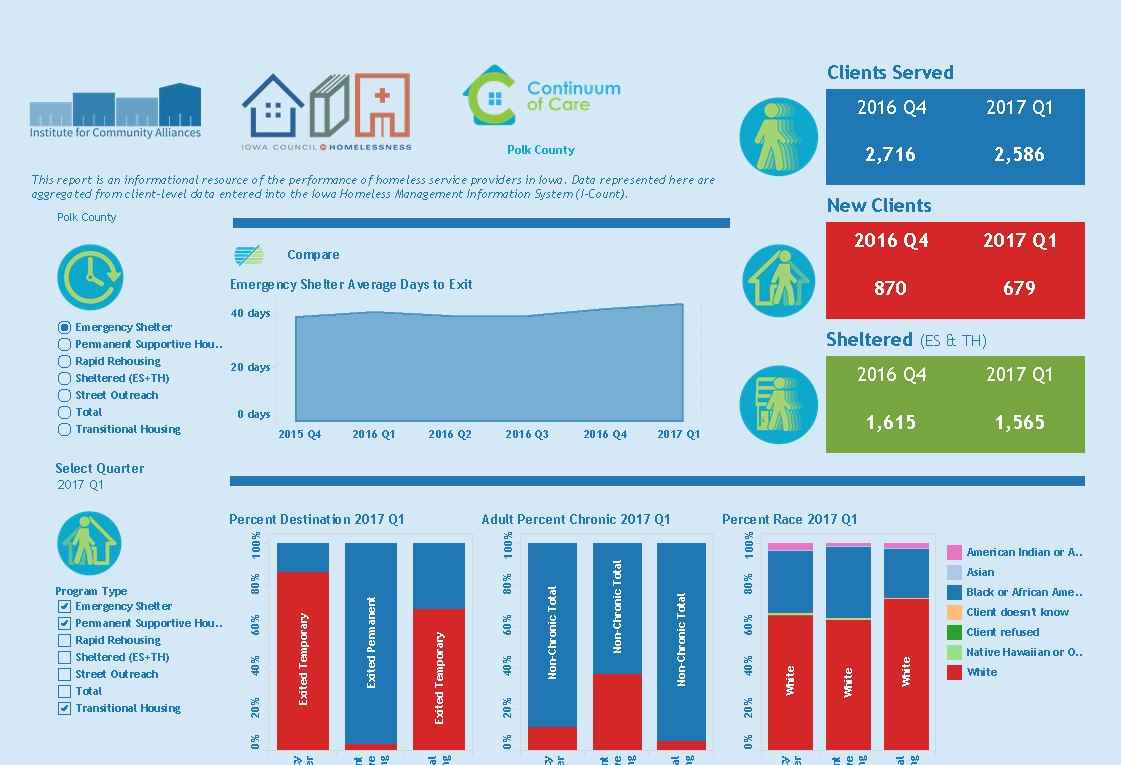
DESCRIPTION
This dashboard includes the data that HUD Continua of Care submitted for Federal Fiscal Years 2015 and 2016. Check out your community's progress toward ending homelessness!
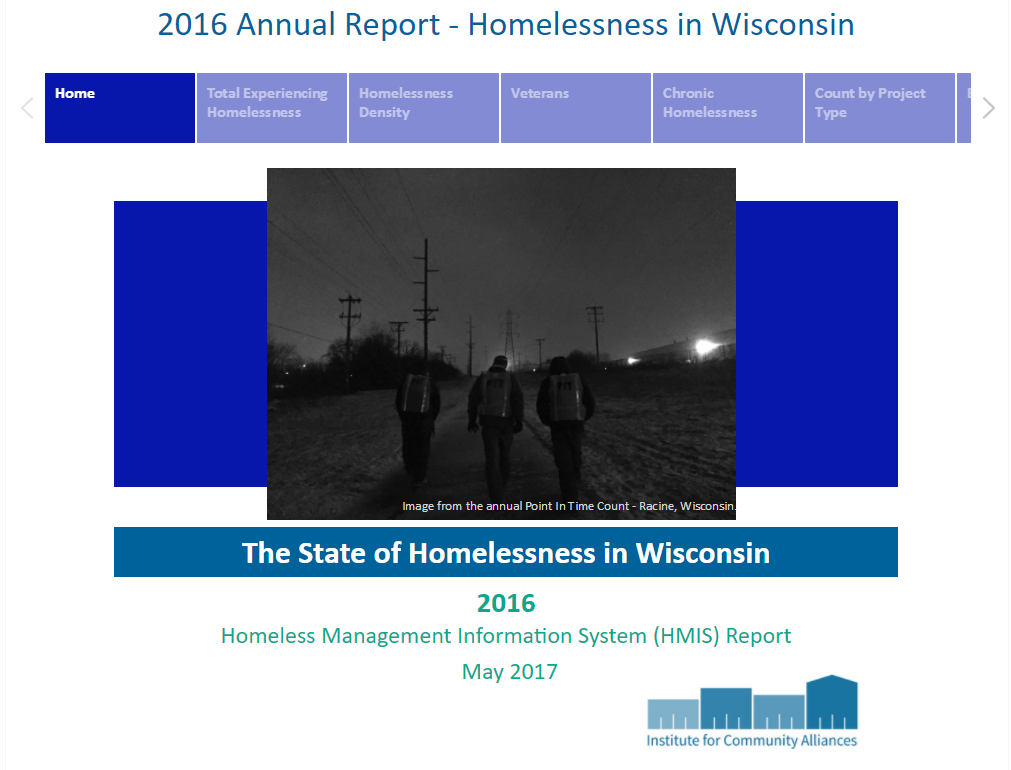
DESCRIPTION:
The Institute for Community Alliances has compiled a report on homelessness in Wisconsin in 2016 based on data from HMIS agencies. This companion dashboard highlights key findings from the report.
KEY FINDINGS:
- 1 in 218 Wisconsin residents experienced homelessness in 2016, but the rate of homelessness varied significantly by region
- The rate of homelessness was highest in Milwaukee County (1 in 114 residents), followed by Brown County (1 in 129), the Northwest CoC (1 in 140), Coulee CoC (1 in 143), and Dane County (1 in 152)
- The rate of homelessness was lowest in the Southwest CoC
- Milwaukee County and the Coulee CoC served the most veterans in 2016, and veterans make up the greatest portion of the homeless population in the Coulee CoC (23 percent)

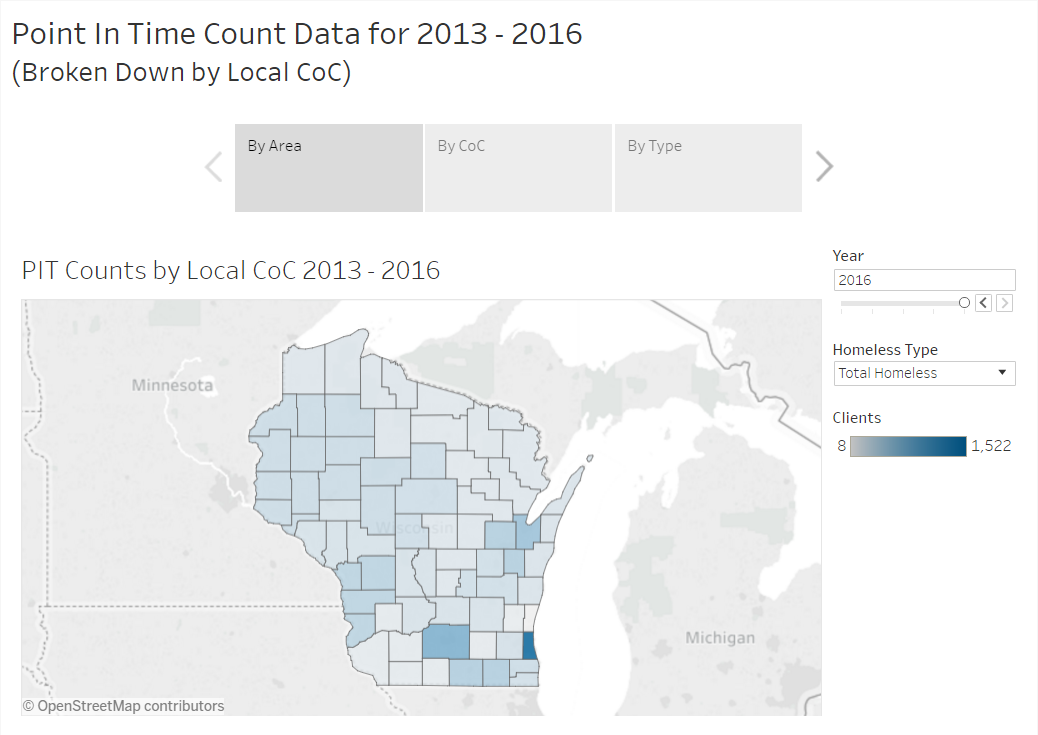
DESCRIPTION:
The Point-in-Time (PIT) count is a count of sheltered and unsheltered homeless persons on a single night in January. This dashboard allows you to explore trends in homelessness by subpopulation and household status by each of the regions in the ICA network.
KEY FINDINGS:
Total Homelessness decreased by 16% across all ICA regions in the past 5 years.
25 of 32 CoCs experienced a drop in homelessness with an average decrease of 12.1%.
Joplin/Jasper, Newton Counties CoC in Missouri had the most significant decrease with an 84.3% drop in total homelessness.
The North Dakota Statewide CoC had the largest increase since 2012 at 58.3%.
This is due to significant changes in local PIT count methodology implemented in 2013.
There has been a 47.4% decline in total homelessness since 2013.
Chronic Homelessness dropped by 26% across all ICA regions since 2012.
Both the Dekalb City & County CoC in Illinois & Southwest Minnesota CoC counted 0 chronically homeless individuals.
24 of our 32 CoCs experienced a drop in chronic homelessness with a 15% average decrease.
Veteran homelessness decreased by 35% across all ICA regions since 2012.
Unaccompanied youth homelessness increased by 0.5% since tracking began in 2015.

DESCRIPTION:
This dashboard maps the zip codes where clients served in Iowa in 2015 reported last having a permanent address.
KEY FINDINGS:
- Most people experiencing homelessness reported a last permanent address in Polk County, followed by Linn and Scott Counties
- However, persons experiencing homelessness came from nearly every county in the state